

Economic status is not etched in stone. The loss of a job or an unexpected illness may push a middle-class family down a notch on the economic ladder. But fortunes can improve, too, with a graduation from college or marriage to an earning partner lifting a lower-income adult into the middle class.
In the United States, the transience of economic status varies significantly across racial and ethnic groups and by level of education, according to a new Pew Research Center analysis of government data. Black and Hispanic adults are more likely than White and Asian adults to move down the income ladder – and less likely to move up it – from one year to the next. Likewise, adults with lower levels of education are more likely than those with more education to see economic regression and less likely to see progression.
In 2021, half of American adults overall lived in middle-income households. But about a third (32%) of those who were in the middle-income tier in 2020 were no longer in that tier in 2021. These adults were equally likely to have moved up to the upper-income tier or down to the lower-income tier – 16% each in each direction – from 2020 to 2021. Some 68% of adults who were in the middle-income tier in 2020 were still in that tier in 2021, during the first year of the coronavirus pandemic.
The movement of adults from the middle-income tier to other income tiers during the pandemic was consistent with recent trends. From 2000 to 2001, some 12% of middle-income adults moved up to the upper-income tier and 14% moved down to the lower-income tier. In the same period, 74% of middle-income adults experienced no change in their economic status. Largely similar rates of transition have prevailed during the entirety of the 2000-2021 timespan.
Changes by race and ethnicity
The share of adults who are in the middle class varies modestly across racial and ethnic groups, ranging from 47% of both Black and Asian adults to 49% of Hispanic adults and 52% of White adults in 2021. While these shares were largely unchanged from 2020, there was considerable movement of adults into and out of the middle class, with substantial variation among racial and ethnic groups.
From 2020 to 2021, around a fifth of Black (22%) and Hispanic (20%) adults experienced a setback from the middle-income tier to the lower-income tier, compared with 15% of White adults and 12% of Asian adults. At the same time, only 8% of Hispanic adults and 12% of Black adults moved up from the middle- to the upper-income tier, compared with 18% of White adults and 25% of Asian adults.
 https://www.pewresearch.org/wp-content/uploads/2022/05/ft_2022.05.10_middleclass_02.png?resize=300,296 300w, https://www.pewresearch.org/wp-content/uploads/2022/05/ft_2022.05.10_middleclass_02.png?resize=768,759 768w, https://www.pewresearch.org/wp-content/uploads/2022/05/ft_2022.05.10_middleclass_02.png?resize=160,158 160w, https://www.pewresearch.org/wp-content/uploads/2022/05/ft_2022.05.10_middleclass_02.png?resize=100,100 100w, https://www.pewresearch.org/wp-content/uploads/2022/05/ft_2022.05.10_middleclass_02.png?resize=410,405 410w, https://www.pewresearch.org/wp-content/uploads/2022/05/ft_2022.05.10_middleclass_02.png?resize=75,75 75w, https://www.pewresearch.org/wp-content/uploads/2022/05/ft_2022.05.10_middleclass_02.png?resize=200,198 200w, https://www.pewresearch.org/wp-content/uploads/2022/05/ft_2022.05.10_middleclass_02.png?resize=260,257 260w, https://www.pewresearch.org/wp-content/uploads/2022/05/ft_2022.05.10_middleclass_02.png?resize=310,306 310w, https://www.pewresearch.org/wp-content/uploads/2022/05/ft_2022.05.10_middleclass_02.png?resize=420,415 420w, https://www.pewresearch.org/wp-content/uploads/2022/05/ft_2022.05.10_middleclass_02.png?resize=640,632 640w, https://www.pewresearch.org/wp-content/uploads/2022/05/ft_2022.05.10_middleclass_02.png?resize=740,731 740w" sizes="(max-width: 840px) 100vw, 840px" style="box-sizing:inherit;border-style:none;height:auto;max-width:100%;vertical-align:bottom;border-radius:inherit">
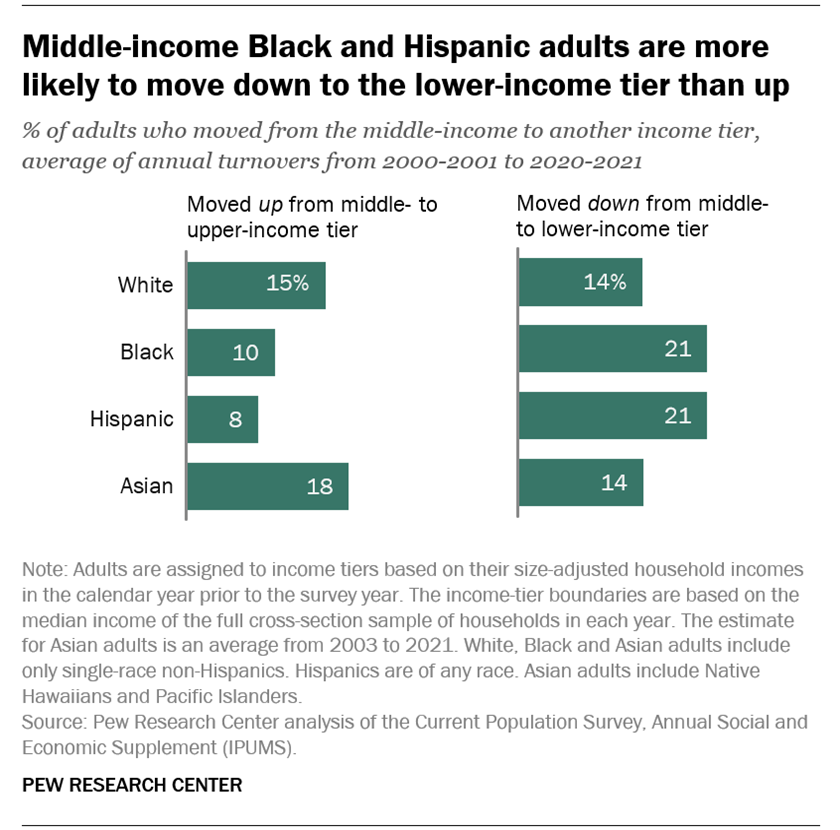
The transitions from the middle-income tier that transpired in the first year of the pandemic were similar to those seen since 2000. Over the 2000-2021 period, an average of about one-in-five Black and Hispanic adults who were in the middle-income tier one year moved down to the lower-income tier by the next year (21% in both groups). That compared with an average of 14% each of middle-income White and Asian adults who took a step down the income ladder. Conversely, while 18% of Asian adults and 15% of White adults moved up from the middle- to the upper-income tier in an average year, only 10% of Black adults and 8% of Hispanic adults experienced such progress.
 https://www.pewresearch.org/wp-content/uploads/2022/05/ft_2022.05.10_middleclass_03.png?resize=268,300 268w, https://www.pewresearch.org/wp-content/uploads/2022/05/ft_2022.05.10_middleclass_03.png?resize=768,859 768w, https://www.pewresearch.org/wp-content/uploads/2022/05/ft_2022.05.10_middleclass_03.png?resize=160,179 160w, https://www.pewresearch.org/wp-content/uploads/2022/05/ft_2022.05.10_middleclass_03.png?resize=362,405 362w, https://www.pewresearch.org/wp-content/uploads/2022/05/ft_2022.05.10_middleclass_03.png?resize=200,224 200w, https://www.pewresearch.org/wp-content/uploads/2022/05/ft_2022.05.10_middleclass_03.png?resize=260,291 260w, https://www.pewresearch.org/wp-content/uploads/2022/05/ft_2022.05.10_middleclass_03.png?resize=310,347 310w, https://www.pewresearch.org/wp-content/uploads/2022/05/ft_2022.05.10_middleclass_03.png?resize=420,470 420w, https://www.pewresearch.org/wp-content/uploads/2022/05/ft_2022.05.10_middleclass_03.png?resize=640,716 640w, https://www.pewresearch.org/wp-content/uploads/2022/05/ft_2022.05.10_middleclass_03.png?resize=740,828 740w" sizes="(max-width: 840px) 100vw, 840px" style="box-sizing:inherit;border-style:none;height:auto;max-width:100%;vertical-align:bottom;border-radius:inherit">
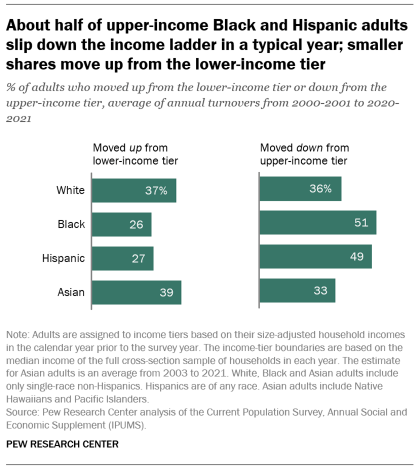
At the lower end of the economic scale, Black and Hispanic adults are almost twice as likely as White and Asian adults to be in the lower-income tier. They are also less likely to progress into the middle- or upper-income tiers in any given year. From 2000 to 2021, some 26% of Black adults and 27% of Hispanic adults, on average, moved up a tier or more from the lower-income tier each year, compared with almost 40% of White and Asian adults.
Not only are Black and Hispanic adults more entrenched in the lower-income tier, they also have a more tenuous grip on the upper-income tier. Currently, only 12% of Black adults and 10% of Hispanic adults live in upper-income households. But, once in that tier, about half move down to the middle- or lower-income tier in an average year. In contrast, White and Asian adults are about two to three times as likely as Black and Hispanic adults to live in upper-income households, and they are also more likely to stay there, with about a third or a bit more moving down to a lower tier in an average year.
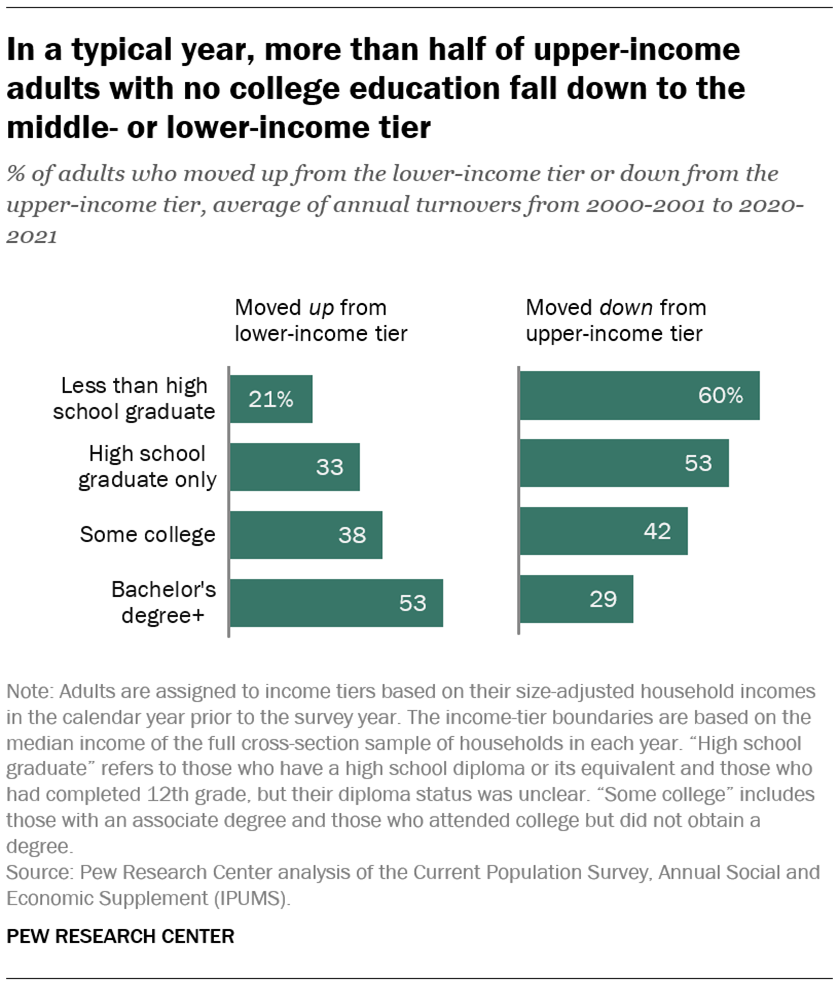
Changes by education level
Financial well-being and economic stability are also strongly related to education. In 2021, the share of adults in the lower-income tier ranged from 13% among those with at least a bachelor’s degree to 57% among those without a high school diploma or its equivalent. Conversely, the share in the upper-income tier varied from 5% among those with less than a high school education to 39% among those with at least a bachelor’s degree.
 https://www.pewresearch.org/wp-content/uploads/2022/05/ft_2022.05.10_middleclass_04.png?resize=274,300 274w, https://www.pewresearch.org/wp-content/uploads/2022/05/ft_2022.05.10_middleclass_04.png?resize=768,841 768w, https://www.pewresearch.org/wp-content/uploads/2022/05/ft_2022.05.10_middleclass_04.png?resize=160,175 160w, https://www.pewresearch.org/wp-content/uploads/2022/05/ft_2022.05.10_middleclass_04.png?resize=370,405 370w, https://www.pewresearch.org/wp-content/uploads/2022/05/ft_2022.05.10_middleclass_04.png?resize=200,219 200w, https://www.pewresearch.org/wp-content/uploads/2022/05/ft_2022.05.10_middleclass_04.png?resize=260,285 260w, https://www.pewresearch.org/wp-content/uploads/2022/05/ft_2022.05.10_middleclass_04.png?resize=310,340 310w, https://www.pewresearch.org/wp-content/uploads/2022/05/ft_2022.05.10_middleclass_04.png?resize=420,460 420w, https://www.pewresearch.org/wp-content/uploads/2022/05/ft_2022.05.10_middleclass_04.png?resize=640,701 640w, https://www.pewresearch.org/wp-content/uploads/2022/05/ft_2022.05.10_middleclass_04.png?resize=740,810 740w" sizes="(max-width: 840px) 100vw, 840px" style="box-sizing:inherit;border-style:none;height:auto;max-width:100%;vertical-align:bottom;border-radius:inherit">
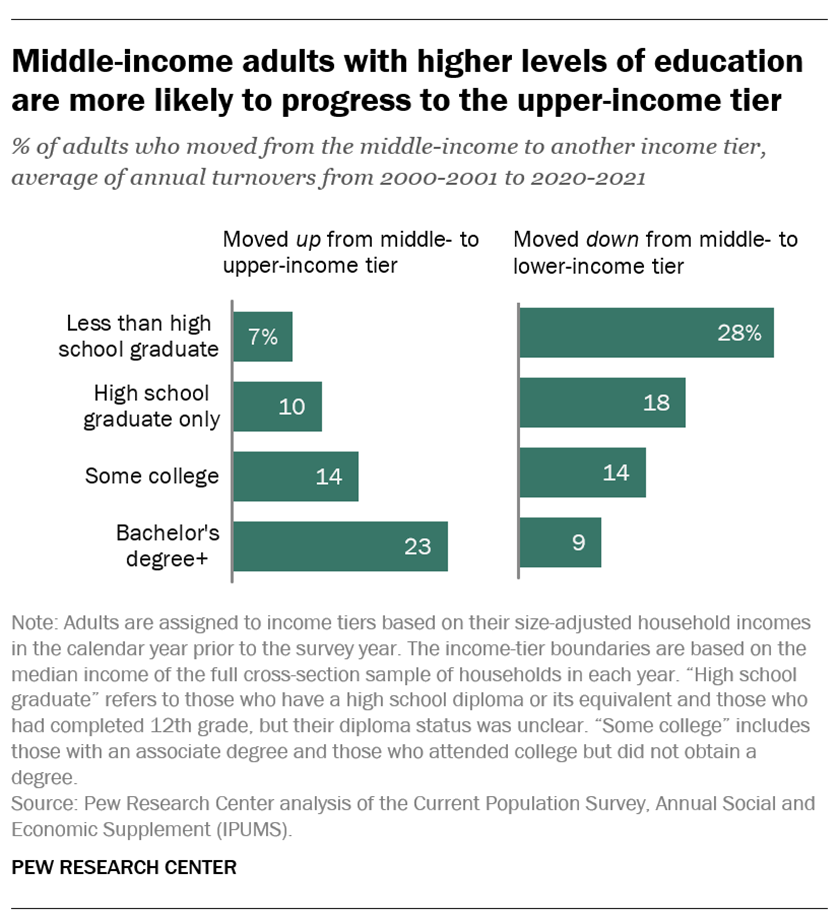
Those with less education are also more likely to slip down the economic ladder from one year to the next. From 2000 to 2021, adults without a high school diploma were about three times as likely as adults with at least a bachelor’s degree to slip from the middle-income tier down to the lower-income tier each year (28% vs. 9%, on average). Among middle-income adults with only a high school diploma, an average of 18% took a step down the economic ladder each year during that span, as did 14% of those with some college education but no degree.
Trends in progress from the middle- to the upper-income tier are virtually the opposite. From 2000 to 2021, adults with at least a bachelor’s degree were about three times as likely as those who did not finish high school to move from the middle- to the upper-income tier each year (23% vs. 7%, on average). College graduates were also more likely than those with a high school diploma only, or some college education but no degree, to move up from the middle-income tier.
 https://www.pewresearch.org/wp-content/uploads/2022/05/ft_2022.05.10_middleclass_05.png?resize=257,300 257w, https://www.pewresearch.org/wp-content/uploads/2022/05/ft_2022.05.10_middleclass_05.png?resize=768,897 768w, https://www.pewresearch.org/wp-content/uploads/2022/05/ft_2022.05.10_middleclass_05.png?resize=160,187 160w, https://www.pewresearch.org/wp-content/uploads/2022/05/ft_2022.05.10_middleclass_05.png?resize=347,405 347w, https://www.pewresearch.org/wp-content/uploads/2022/05/ft_2022.05.10_middleclass_05.png?resize=200,234 200w, https://www.pewresearch.org/wp-content/uploads/2022/05/ft_2022.05.10_middleclass_05.png?resize=260,304 260w, https://www.pewresearch.org/wp-content/uploads/2022/05/ft_2022.05.10_middleclass_05.png?resize=310,362 310w, https://www.pewresearch.org/wp-content/uploads/2022/05/ft_2022.05.10_middleclass_05.png?resize=420,491 420w, https://www.pewresearch.org/wp-content/uploads/2022/05/ft_2022.05.10_middleclass_05.png?resize=640,747 640w, https://www.pewresearch.org/wp-content/uploads/2022/05/ft_2022.05.10_middleclass_05.png?resize=740,864 740w" sizes="(max-width: 840px) 100vw, 840px" style="box-sizing:inherit;border-style:none;height:auto;max-width:100%;vertical-align:bottom;border-radius:inherit">
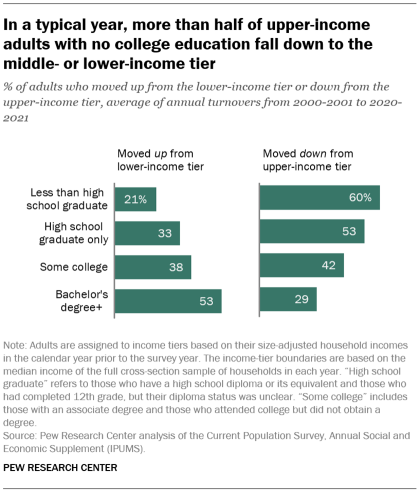
As is the case with racial and ethnic groups, economic transience is even more prevalent among adults of different education levels in the lower- and upper-income tiers. Among lower-income adults, an average of 53% of those with at least a bachelor’s degree progressed to the middle- or upper-income tier annually over the 2000-2021 period. But only 21% of those who did not finish high school were able to take this step. Among upper-income adults, an average of 60% of those with less than a high school education saw regression to the middle- or lower-income tiers each year, compared with 29% of those with at least a bachelor’s degree.
The shuffling of adults across economic tiers is driven by the change in their household income from one year to the next. Across racial and ethnic groups and education levels, adults who moved up from the lower- to the middle-income tier in the 2000-2021 timespan experienced a near doubling or an even higher increase in their median household income in a typical year. Those moving up from the middle- to the upper-income tier saw their household income rise by 65% or more at the median.
Adults who stepped down the ladder – from the middle- to the lower-income tier or from upper- to middle-income – experienced about a 40% to 55% loss in household income at the median in a typical year. The magnitude of income gains or losses varied little across racial and ethnic groups or across education groups. But the pattern of movement across income tiers suggests that Black and Hispanic adults, as well as adults with less education, were more likely than White and Asian adults, and Americans who have more education, to experience a loss in income than a gain.